

result

result


PREVIOUS
NEXT


Follow Us


All content Copyright 2023 Fixed Income Insights. All rights reserved.


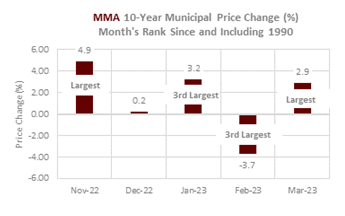
The first quarter of 2023 has been defined by high volatility and low primary issuance. In the first three months of the year, the MMA 10-year price index reflected a record or near record monthly gain or loss (graph below). YTD, the municipal price index has posted a cumulative gain of ~2.9%. The turmoil in the banking sector and speculation over the Fed’s intended policy path have led to extraordinary swings in Treasury yields, reminiscent of crisis periods including Lehman’s collapse (’08), the 9/11 attacks (’01), UAL buyout collapse (’89), and Black Monday (’87). The volatility of the US equity and Treasury markets has bled into the municipal sector. Until 1Q23, there had not been three consecutive monthly returns exceeding +/- 2.50% since 1983. Just 58% of 2023’s YTD trading sessions finished unchanged vs. the long-term average of 64%.
Since the Fed began its tightening cycle, municipal bond supply has slowed, so that deal flow has fallen short of monthly averages for the last 11 consecutive months. That lighter issuance trend continued in the first quarter of 2023, pushing the rolling 12-month issuance pace to $339B at March’s end—a relatively low total. Historically without acute demand (TOBs), restructurings (ARS) of refundings it has been rare that annual issuance has been more than $400B. Measures of secondary supply were mixed with bids-wanted par totals cooling into quarter end, and municipal offering totals picking up. Municipal bond fund outflows were persistent in 2022, but January’s unusually strong start was accompanied by inflows. The AUM gains were short lived. In February, there was a return to outflows, as well as an exodus from ETFs. Outflows were generally most evident in short-term funds. January’s gains were nearly erased by February’s losses, before municipals posted historically and unusually strong returns in March.
The municipal curve’s flattening inside 10-years was significant in 1Q23 (February). The municipal 2 to 10-year slope inverted once, in September, 1966, by -5 bps. Over the last 50 years, an extremely flat 2 to 10-year slope has often been followed by a period of swift and large steepening, resulting, mostly, from a front-end rally (particularly following near-inversions in ‘89, ‘00 and ‘07). The MMA 5% AAA benchmark 2s/10s spread was 37bps at the start of the year, and had narrowed to 18bps at February’s end, before widening to 28bps at the end of the quarter.
JANUARY
Throughout nearly the entire month, MMA’s municipal price index was positive. After the explosive rally to start the month, upward momentum cooled. Still, MMA’s municipal 10-year index posted its 3rd largest gain since and including 1990. The new year rally recalled a similar advance in 2008-09, when the year ended and new year began with extraordinary gains. Both 2008 and 2022 were defined by high volatility, the reduced demand from the leading institutional investors, extended overbought conditions and overvalued evaluations. In addition, both years revealed the risks to closed-end funds that either struggled to make or cut their dividend payments. The two year-end rallies posted cumulative gains of ~6%. In January, retail, which represented the demand driver in 2022, waned, as suggested by the -28% decline in small block transactions as compared to November. Institutional trading fell -14% but did increase in the latter portion of the month when weekly municipal bond mutual funds experienced inflows. Long and high yield funds drew investors after the gains early in the month. Mutual fund investors appeared to chase positive returns while SMA accounts took advantage of higher yields in 2022. The “risk on” context manifested in narrower credit spreads and stronger TRR performance among lower rated indexes and high yield funds – despite emerging credit concerns. Municipal performance, relative to taxable alternatives was superior, except when compared to US IG corporates. Tax-exempts’ 3-month rally was stronger than comparable sovereign debt including the US. Ratios remained well below, -2 standard deviations, their 60-day averages, reflective of tax-exempts’ “richness.” Similarly, MMA’s municipal value index ended the month at its lowest (i.e. favored issuers) level since May 2020. The municipal yield curve was relatively stable, though historical patterns suggested a steepening trend could emerge of some consequence. January municipal issuance was -17% below the month’s decade average and the 3-month rolling issuance average was the lowest, below $20B, since May 2011. Taxable issuance fell to $1B-$2B. Secondary breaks of the largest new issues were the smallest for a month of the past 3 years indicative of early January’s high demand. However, evidence of limited investor value emerged as January’s largest primary issues’ pricings, had 10-year taxable equivalent yields near or below 4%. Fundamentally, the Federal Reserve policy, inflation measures and the debate around the debt ceiling represented ongoing concerns for the municipal market. In January, tax-exempts’ responded positively to the monthly Jobs and CPI reports, as oil prices declined to below $80/barrel. US equities also posted solid gains in January, so that over recent time periods, municipals and equity indexes (i.e. DJIA) performed similarly.
FEBRUARY
MMA’s municipal 10-year price index posted its 2nd worst performance for the month of February—a -3.8% decline. It was only the 5th time since and including 1990 that a loss of -2% or more had happened. The adversity occurred amid a “bear steepener” that inverted the front of the curve, negatively impacted 5% coupons and high-grade bonds and generated a resurgence of retail trade activity and a decline of institutional trading. The latter coincided with the resumption of not only mutual fund outflows, but also an exodus from ETFs. The beneficiary from the shift away from bond funds was tax-exempt money market funds that, despite AUM volatility in 2023, attracted $6B in the month’s last week. While February’s municipal decline was excessive, as denoted by technical “oversold” conditions at month-end, it was not unexpected given January’s ~3% price gain. Following the rare large January advances in 2009 and 2020, a significant decline occurred in 1Q. The month’s loss was also not unusual given the seasonal patterns of 1Q, when the quarter’s price peak had been mid-January. This was especially evident in the 1994-1999 period when the tax-exempt market was similarly overly reliant on individual investors’ demand for bonds. Municipal benchmark yields were still lower than October’s peak by ~50 bps, and as a result retail and institutional trade activity, compared to November, were respectively -29% and -19% lower. The lighter secondary activity was joined by unusually light February issuance, ~$18B. Historically, February has averaged 10% more than January, but this year the month was ~-17% less. The 12-month issuance pace fell to $353B. It was the post BABs years of 2011, 2012 and 2014 that issuance was < $350B annually. Credit spreads were relatively stable which can occur amid volatility, though the high yield sectors of tobacco and PR underperformed because of high yield fund outflows. Ratings agencies’ analytical divisions reported on the physical climate risks of municipal issuers, and S&P specifically cited coastal city hospitals that would require protective adaptation financings. In addition, Nature Climate Change focused on the vulnerability of the housing sector because of the unpriced climate risks and overvaluation of the US markets. Municipal prices suffered after February’s key fundamental reports of jobs, FOMC rate decision and CPI.
MARCH
March’s municipal 10-year price gain of 3.14% exceeded the month’s advances of 2000, 2008, 2016 and 2019. It was the strongest price rally for the month since 1976. March 2019 was a year where, similar to 2023, municipals gained more than 2.50%. And contrary to the returns in 2000, 2008 and 2016 where corrective price action emerged, 2019’s rally extended further into June (although 2019’s fundamentals were vastly different from current, noting far less accommodative monetary policy and negligible inflation fears). When gains have exceeded 2.50% over a rolling 1-month period, further gains have occurred just as often as losses over the next 1-month and 3-month periods - adding to 2Q23’s uncertainty. The strength in March did erase what had been YTD price losses through February. Constructive price momentum returned on March 8 and the MMA Price Index remained in a positive condition through month-end. Mutual fund flows were less consistent but remained slightly negative. Funds’ inconsistency muted institutional trading activity in March. The year’s volatility also unnerved retail investors, and the swift changes to evaluations were a distraction that limited small block trades. As March concluded, there was also little investor opportunity evident in evaluations; the latter amplified at month-end by aggressively bid high-grade competitive sales. The month’s banking sector issues, in addition to inflation and economic concerns, generated enough uncertainty to place greater scrutiny on municipal credit. More care was taken with respect to credit and duration extension – despite renewed inflows into long and high-yield funds. Secondary trade breaks reflected a more cautious underwriting context for riskier sectors. Municipal supply was once again below the month’s average in March—the 11th consecutive month of such to occur. T-E MMF AUM held above $110B, and similar to bonds, a scarcity of 2a7 eligible securities resulted in the largest 1Q TOB (>$2B) creation since and including 2011. Lastly, municipal price responses to fundamental releases improved amid ambiguous economic data.