

result

result


PREVIOUS
NEXT


Follow Us


All content Copyright 2024 Fixed Income Insights. All rights reserved.


MMA’s 10-year index’s positive return of 7.44% in 2023 was not only consistent with the recovery following a year of significant loss but was also greater than the average return since 1965.Q423 was defined by more dovish Fed sentiment and expectations of a pivot in 2024. Following losses in October, the final two months of 2023 posted a cumulative total return of 9.58% for municipals, the strongest 2-month TRR advance since August 1982 and the fourth strongest 2-month advance on record since 1965. Short-term Treasuries rallied ~100 bps in 4Q23; and municipals followed, with MMA’s AAA 5% Benchmark 2-yr yield falling to 2.56% on December 29th, down from 3.59% at September’s end.
While municipals and Treasuries both rallied in Q4, municipals generally outperformed so that relative value ratios dropped considerably. Bloomberg’s AAA municipal 10-yr yield as a percentage of the US Treasury yield dropped from ~75% at the end of Q3 to ~58% at year end, which was the lowest it had been since June 2021. Municipal fund flows remained biased towards outflows throughout Q4, though the magnitude of the outflows waned in December. There seemed to be greater interest in extending duration, as long-term municipal funds started to see inflows. In 2023, municipal bond issuance was down -2.8% YoY, following a more robust than expected Q4. December’s municipal issuance, at $23.8B, was up 17% from December 2022. MMA expects issuance to trend upward in 2024 amid expectations of rate cuts, and because of climate related needs issuance could well reach an annual total in excess of $600B by the end of the decade.
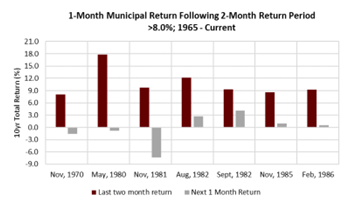
An exceptional 2-month gain has rarely been followed by a large 1-month loss. Rather, it has more often been followed by small gains or stability.
OCTOBER
Price momentum remained negative for most of October. There was a brief reprieve at mid-month following news of renewed Middle East conflict. However, municipals resumed their progression to higher yields soon after retail sales, employment and CPI data reiterated the strength and resilience of the US consumer. The latter continued to produce great angst for financial markets, resulting in another month of heightened Treasury and municipal volatility. October was the 8th month of the year of above average daily municipal price movement, with just 45% of sessions finishing unchanged vs. an average of 65% over the prior decade. Municipal high yield (HY) had outperformed investment-grade (IG) YTD; however, in October, IG posted better returns across most maturities, suggestive of retail’s pursuit of value and wariness of HY risks. October’s adversity was reflected via the six sessions of extreme price loss, but October 10th and 11th were also the first and fifth strongest sessions of the year, and represented the second largest two-day price gain since April, 2020. Ultimately, the MMA Price Index posted a loss of -1.35%, consistent with October’s seasonal bias since 1990. The month also represented the third consecutive month of higher yields, and was the fifth October of the last seven to suffer price declines in excess of -1.0%. Among the challenges for the municipal market was the placement of a larger new issue calendar. The mid-month return of negative momentum created greater investor hesitancy, and resulted in more cautious primary pricing. October issuance was $37B, which was +36% above September, but -11% below October’s average issuance over the last decade. October was 2023’s largest month of issuance. Daily offering par remained elevated, as did municipal bids wanted par. Competitive sales did provide some assistance to reduce the month’s losses. But the heavy calendar was priced into numerous volatile fundamental events, including the election of a new US House Speaker. Wealth managers and media outlets also amplified the perspective that tax-exempts were projecting solid performance and entry points, which, in addition to tax-loss swaps, resulted in soaring retail and institutional trading volumes. Price momentum closed the month in a neutral condition.
NOVEMBER
The municipal market was emboldened by October’s ending value which was pursued with intensity. Both retail and institutional activity surged at November’s start, the former fully embraced taxable-equivalent yields >6.0% and the latter assisted by the tapering of mutual fund outflows. The allure of securing 5-6% long-term yields resulted in the best November price gain on record, +7.2%. November 2023 also posted the strongest 10yr municipal total return of any month in 41 years, and the sixth strongest monthly return on record since 1965. While value was pursued, the month’s fundamental events provided support—the US Treasury released estimates of long-term debt issuance, the FOMC held rates steady, nonfarm and CPI fell below expectations, and Fed officials’ rhetoric at month-end appeared more conservative—all of which tempered expectations of further rate hikes. Following November’s extraordinary gain, returns for the year were once again positive, consistent with the historical tendency for annual gains to occur following large loss years. Still, the period of great “opportunity” that defined the market at October’s end concluded, so that the tax-exempt market was all about sustaining the price momentum that had been in place since November 1. November’s positive trend was in place for 21 sessions, which was 6 sessions longer than the average length of a positive trend since 2018. Tax-exempt yields remained > 2.5-3.0% at November’s end, but were off their highs and below their long-term averages. The narrative of missing price appreciation by failing to extend duration grew louder in November; and was a theme echoed by several large managers who highlighted the risks of remaining in “cash” too long. In November, money began to move further out the curve and away from money market and short duration mutual funds. Lipper reported intermediate, long and high-yield (HY) inflows during the month’s 2H, while T-E MMF AUM fell off its peak as SIFMA reset lower. Investment-grade (IG) outperformed high-yield (HY) across most maturities, but HY had still outperformed YTD. Like November 2022, the tobacco and PR indices led HY sectors. Only Norway and UK sovereign debt outperformed tax-exempts across developed counties, while TX tightened the most among US state indices. November’s supply was $28B, so the month finished below its decade average by -6.0%.
DECEMBER
MMA’s municipal price index posted a 2.26% gain in December, the month’s largest price advance since 2011 and 5th largest since 1990. The final two months of 2023 posted a cumulative total return of 9.58%, the strongest 2-month TRR advance since August 1982 and the fourth strongest 2-month advance on record since 1965. It was an extraordinary conclusion to a year of extreme volatility and fundamental ambiguity. December reflected many of the characteristics that defined the municipal market in 2023, including: 1) above average price volatility, 2) a better performing 1H vs. 2H, 3) the dominance of retail demand while 4) mutual funds continued to lose assets, 5) high-yield (HY) outperformance, 6) 5% coupon prevalence in the primary, and 7) a high dependency on economic data and Fed policy. Fixed-income in December was initially supported by a decline in both job openings and oil prices, but better nonfarm data along with growing tension in the Red Sea shifted sentiment; until a dovish pivot by the FOMC rallied UST yields into year-end. Municipal investors in December exhibited greater interest in extending further out the curve, evidenced by (albeit minor) long-term mutual fund inflows and a modest retreat from tax-exempt money market funds. SIFMA’s 7-day rate reset lower at month-end to 3.87% while T-E MMF AUM declined by ~$4B. Short-term Treasuries also rallied ~100 bps in 4Q23; meaning lower “cash” returns may add to investors interest in extending duration even further. Similar to November, the absence of value and overbought condition in December meant individuals needed to be lured by the prospects of capturing total return rather than income. Municipal returns in December were also assisted by lower issuance. The absence of product resulted in a favorable supply/demand imbalance that provided underlying support. Finally, while it required patience, discipline and trust in history, MMA’s 10-year index’s positive return of 7.44% in 2023 was not only consistent with the recovery following a year of significant loss, but was also greater than the average return since 1965.
This content is drawn from MMA's Monthly Advisor Publication. To subscribe, inquiries can be sent to info@mma-research.com.